首页上一页 1 下一页尾页 1 条记录 1/1页
import pandas as pd
import matplotlib.pyplot as plt
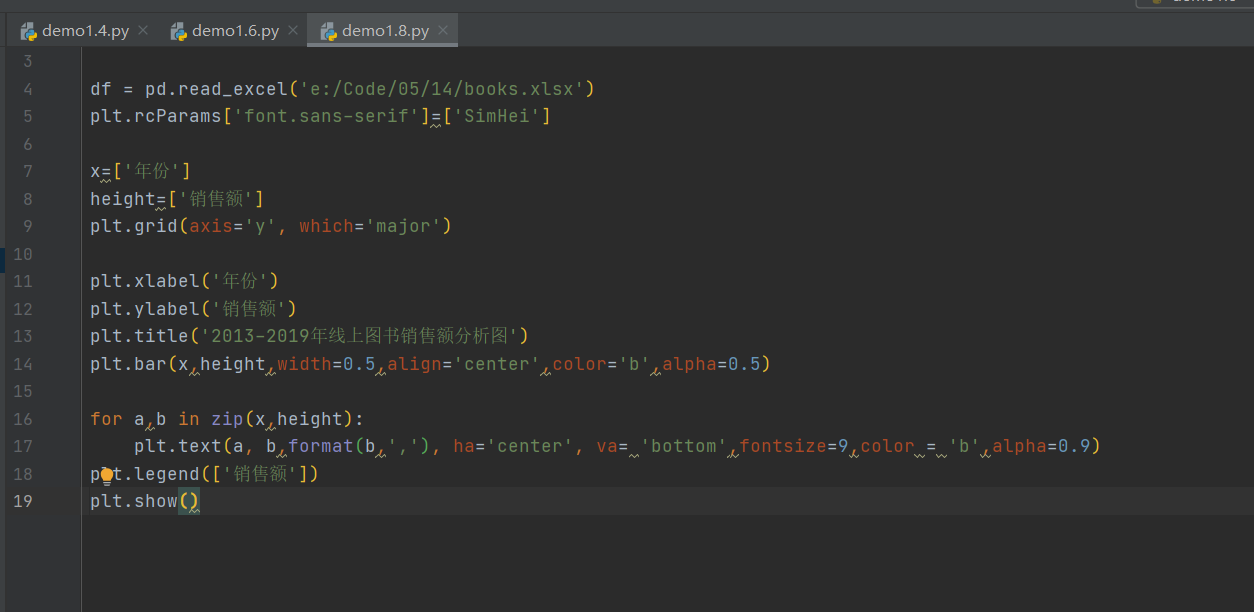
df = pd.read_excel('e:/Code/05/14/books.xlsx')
plt.rcParams['font.sans-serif']=['SimHei']
x=['年份']
height=['销售额']
plt.grid(axis='y', which='major')
plt.xlabel('年份')
plt.ylabel('线上销售额(元)')
plt.title('2013-2019年线上图书销售额分析图')
plt.bar(x,height,width=0.5,align='center',color='b',alpha=0.5)
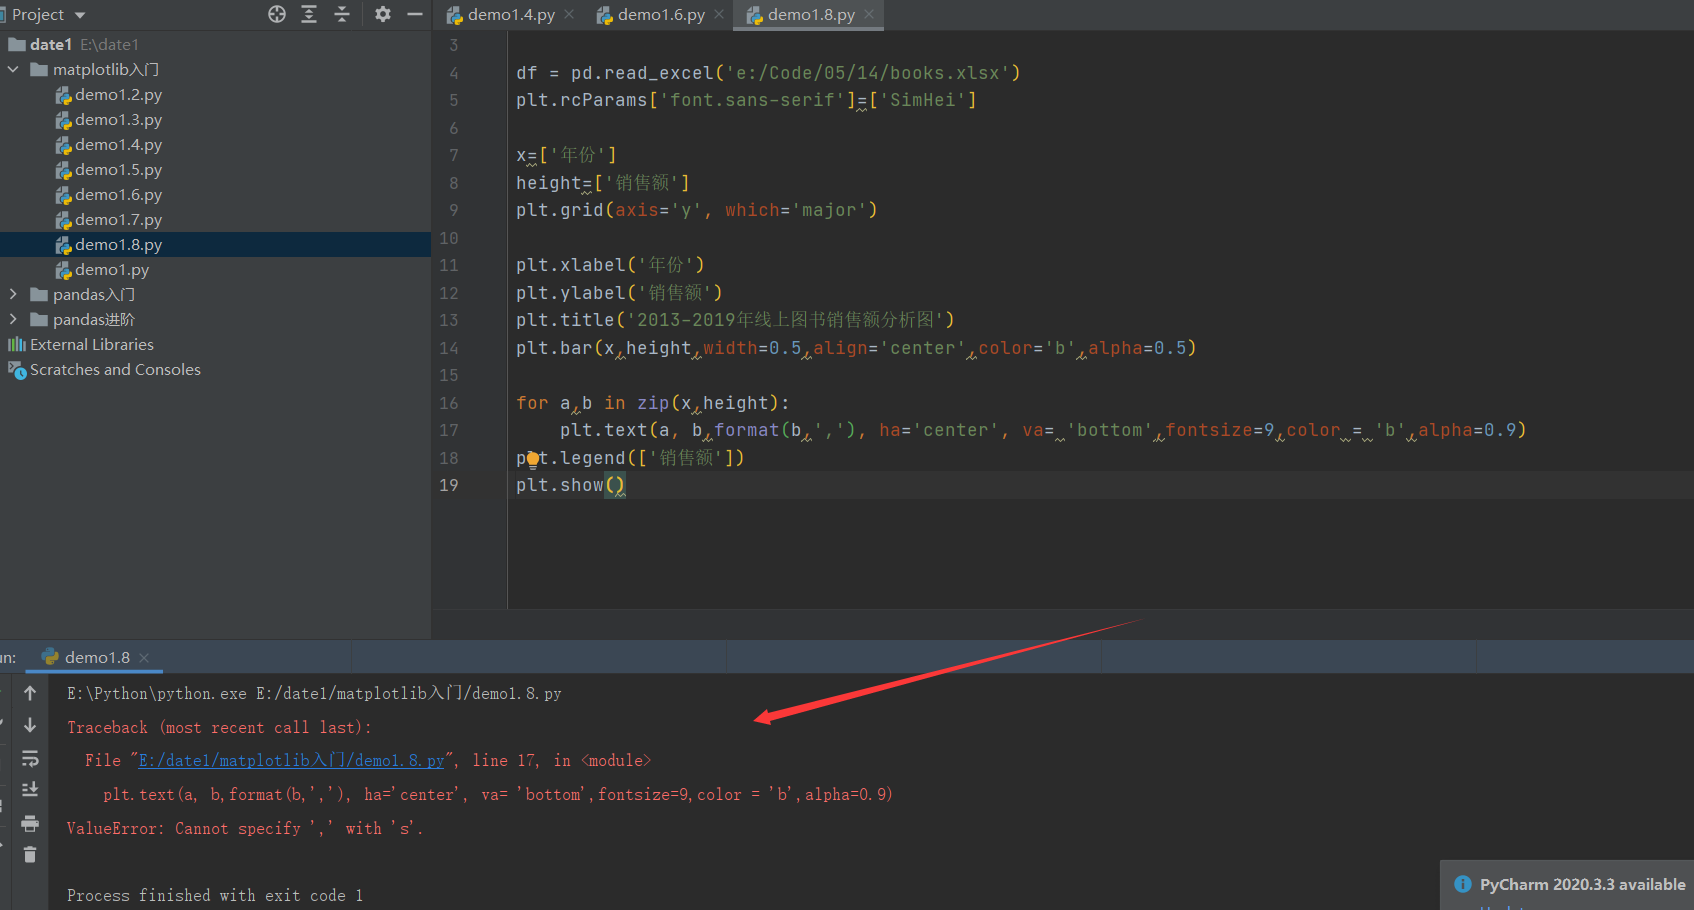
for a,b in zip(x,height):
plt.text(a, b,format(b,','), ha='center', va= 'bottom',fontsize=9,color = 'b',alpha=0.9)
plt.legend(['销售额'])
plt.subplots_adjust(left=0.15, right=0.9, top=0.8,bottom=0.15,hspace=0.1, wspace=0.1)
plt.show()